Own Companies, Not Stocks
How to think like a business owner
Day 58
I recently revisited an interview with Warren Buffett, where he described a pivotal moment in his investing journey:
“When I was 11, I picked stocks. I had the whole wrong idea. I thought stocks were things that went up and down. Then I read Ben Graham’s The Intelligent Investor and realized I was doing it all wrong. From that point on, I never bought another stock—I bought businesses.”
Buffett’s mindset shift—from trading stocks to owning businesses—changed everything. By focusing on the fundamentals of companies rather than short-term price movements, he unlocked the secret to long-term investing success.
Think Like a Business Owner
Imagine you’re buying your local coffee shop. What would you want to know?
How much money is it making?
Can it cover its debts?
Is the management team effective?
How’s the competition?
Investing in publicly traded companies should follow the same logic. Don’t get lost in stock charts or market noise—focus on understanding the business itself.The good news is that successful investors like Buffett have passed down simple metrics to help us analyze companies. These metrics are just fancy terms for the same questions you’d ask if you were buying that coffee shop. Let’s break them down:
1. Revenue Growth (Target: Above 5%)
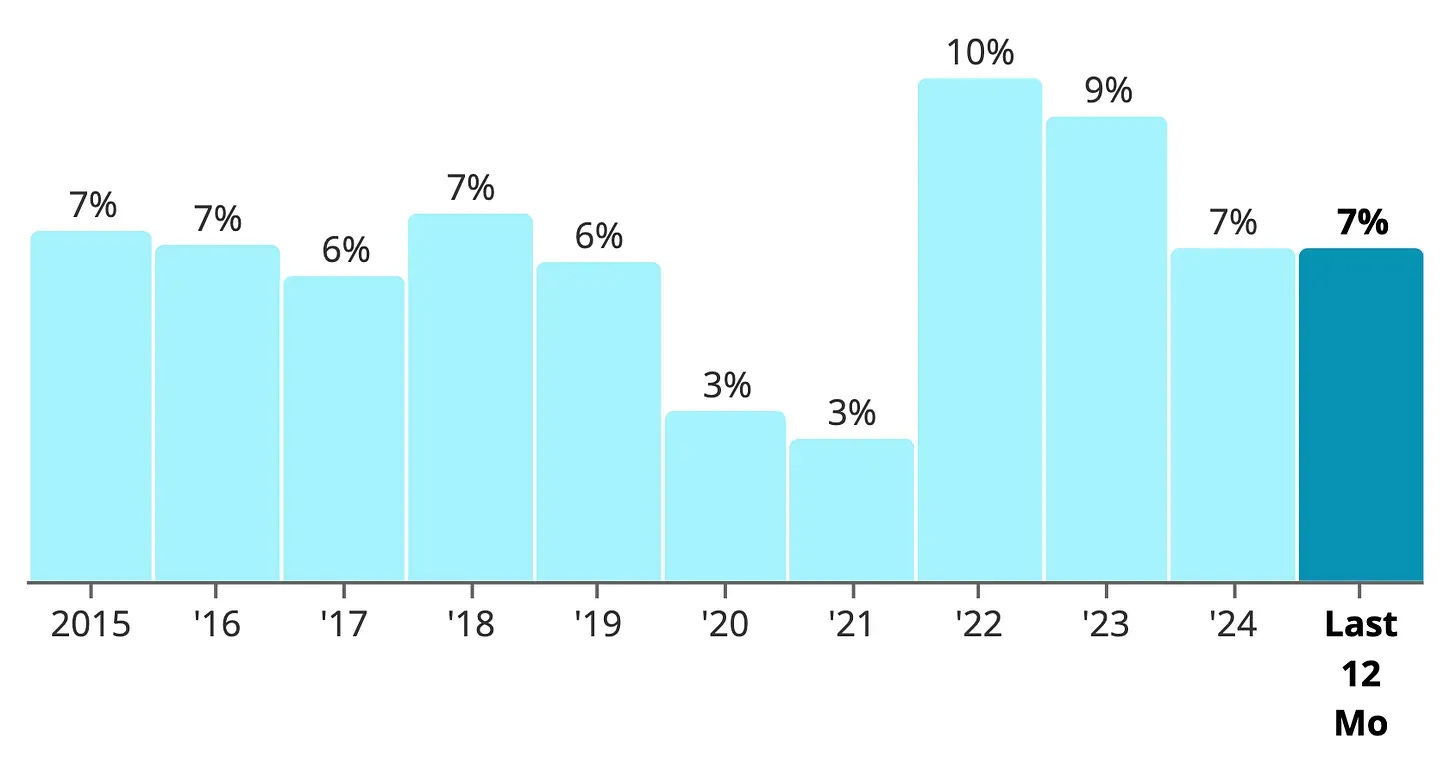
Revenue growth shows how much a company’s sales are increasing year over year. Consistent growth above 5% signals progress beyond inflation and indicates a healthy business trajectory.
Example: Automatic Data Processing (ADP), a leader in payroll and HR software, has a 7% revenue growth rate—well above our benchmark.
2. Free Cash Flow Margin (Target: Above 20%)
Free cash flow (FCF) is the cash left after expenses and investments. It’s essential for paying dividends, repaying debt, or reinvesting in the business. A strong FCF margin of 20% or higher indicates financial strength.
Example: ADP has a 19% FCF margin—just shy of our target but still solid.
3. Return on Invested Capital (ROIC) (Target: Above 18%)
ROIC measures how efficiently management invests capital to generate returns. A high ROIC means smart use of resources and strong profitability.
Example: ADP boasts an impressive 60% ROIC, reflecting exceptional management.
4. Net Debt to Free Cash Flow (Target: Below 3)
This metric shows how quickly a company could pay off its debt using free cash flow. A ratio below 3 is ideal for financial stability.
Example: ADP’s net debt to EBITDA is just 0.16—it could pay off its debt in two months!
The Bigger Picture
Thinking like a business owner takes the stress out of investing. You’re not gambling on stock prices—you’re partnering with great companies for the long haul. By focusing on these four metrics, you can confidently evaluate businesses:
Revenue Growth (>5%)
Free Cash Flow Margin (>20%)
Return on Invested Capital (>18%)
Net Debt to Free Cash Flow (<3)
As I analyze companies in my “Walk to Wealth” portfolio, I’ll use these metrics to guide decisions—and share insights with you along the way.If this resonates with you, subscribe for updates and share this post with someone who might find it helpful!
Until next time, keep walking
Jeremy ✌️


