Jelly Beans and the Stock Market
Trust your gut, not the noise
Day 30 | Portfolio $3,531
True story.
A famous investor walks into a class of students with a jar of jelly beans. He was invited there to be a guest lecturer and teach the kids about the stock market.
He passes the jar around the class and asks the students to write down how many jelly beans they think are in the jar. One by one, the kids spin the jar around in their hands sizing it up to determine their number.
After everyone has turned in their guess, the investor tells the class he is now going to go around the room and give them a second chance to guess how many jelly beans are in the jar. They can stick with their original guess or change it. It’s up to them. But this would be their final answer.
As each kid announces their guess, he makes a list on the board. Once all guesses have been spoken, he averages them out. As a group, their final guess is 886 jelly beans.
Next, he pulls out the cards they turned in at the beginning of class and tallies up their numbers. The average of their original guesses was 1,771 jelly beans.
Then he tells them the number in the jar is actually 1,776 jelly beans!
The Lesson?
The stock market often mirrors this exercise. The first guess represents independent analysis—your own research and conviction. The second guess reflects how opinions shift when influenced by external noise, much like market sentiment swayed by news, social media, or peer discussions. In this case, sticking to one’s original analysis proved closer to the truth.
It’s easy to hear this story and think us adults are way smarter than a bunch of kids.
But are we really?
Most people spend time analyzing stocks and come to a pretty good decision. But then they talk to their friends, their coworkers, their social media feeds (aka the market) and second guess themself.
They follow the noise not the fundamentals.
The wise investor that visited the classroom that day was Joel Greenblatt, author of the best-selling book, The Little Book That Beats the Market.
The Market is a Pendulum
As legendary investor, Benjamin Graham says,
“In the short run, the market is a voting machine, but in the long run, it is a weighing machine.”
My interpretation: The market is a popularity contest where folks buy stocks as they trend up and sell when they trend down.
Not much different than the students who changed their jelly bean guess to follow the class’ answer.
Imagine a pendulum that swings back and forth. One day, it swings wildly to the right. The very next day it overcorrects and swings violently in the opposite direction.
While the pendulum represents the swings of the market, it also presents opportunitiesfor those who are patient and brave enough to go against the flow.
In the Intelligent Investor, Benjamin Graham uses a similar analogy,
"The market is a pendulum that forever swings between unsustainable optimism (which makes stocks too expensive) and unjustified pessimism (which makes them too cheap). The intelligent investor is a realist who sells to optimists and buys from pessimists."
For me, as a long-term investor, the real opportunity is to buy when the market swings too pessimistic on one of the high-quality companies I have in my 30-stock portfolio.
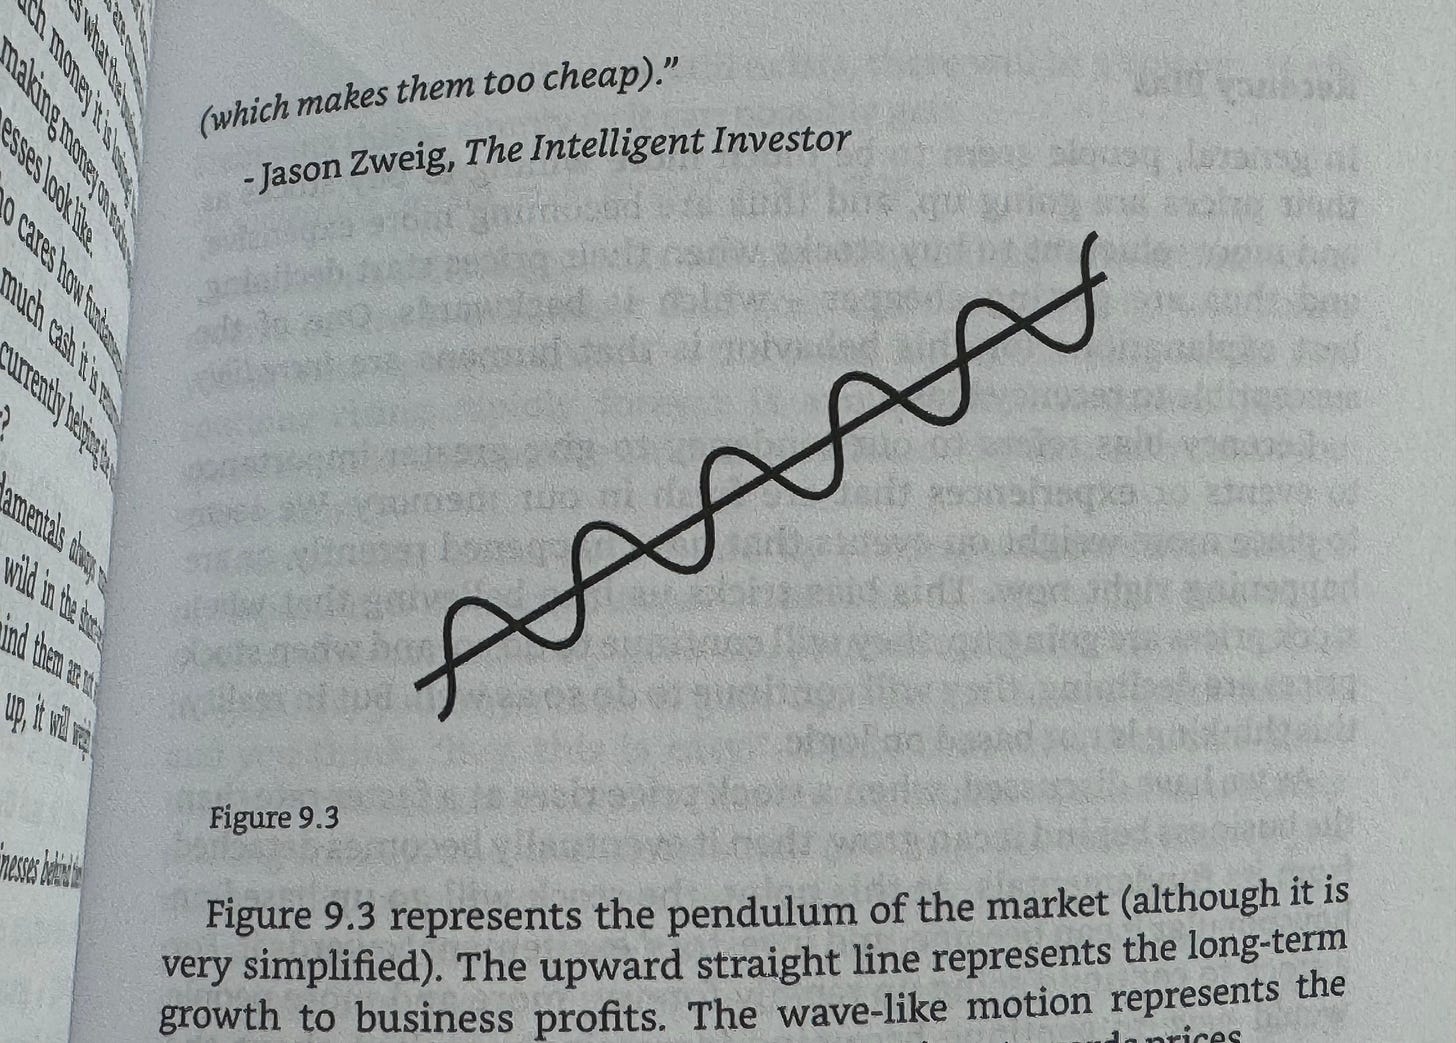
While overly simplistic (which isn’t necessarily a bad thing) we can think of the market as Daniel Pronk draws it out in his book, The Fundamentals of Investing.
One line is straight and represents the fundamentals of the business. The second line squiggles up and down like a wave representing the market’s agressive swings.
High-quality companies usually trend upward overtime providing patient investors (that’s me and you) buying opportunities whenever the market pendulum swings too far in one direction.
Putting Patience Into Practice
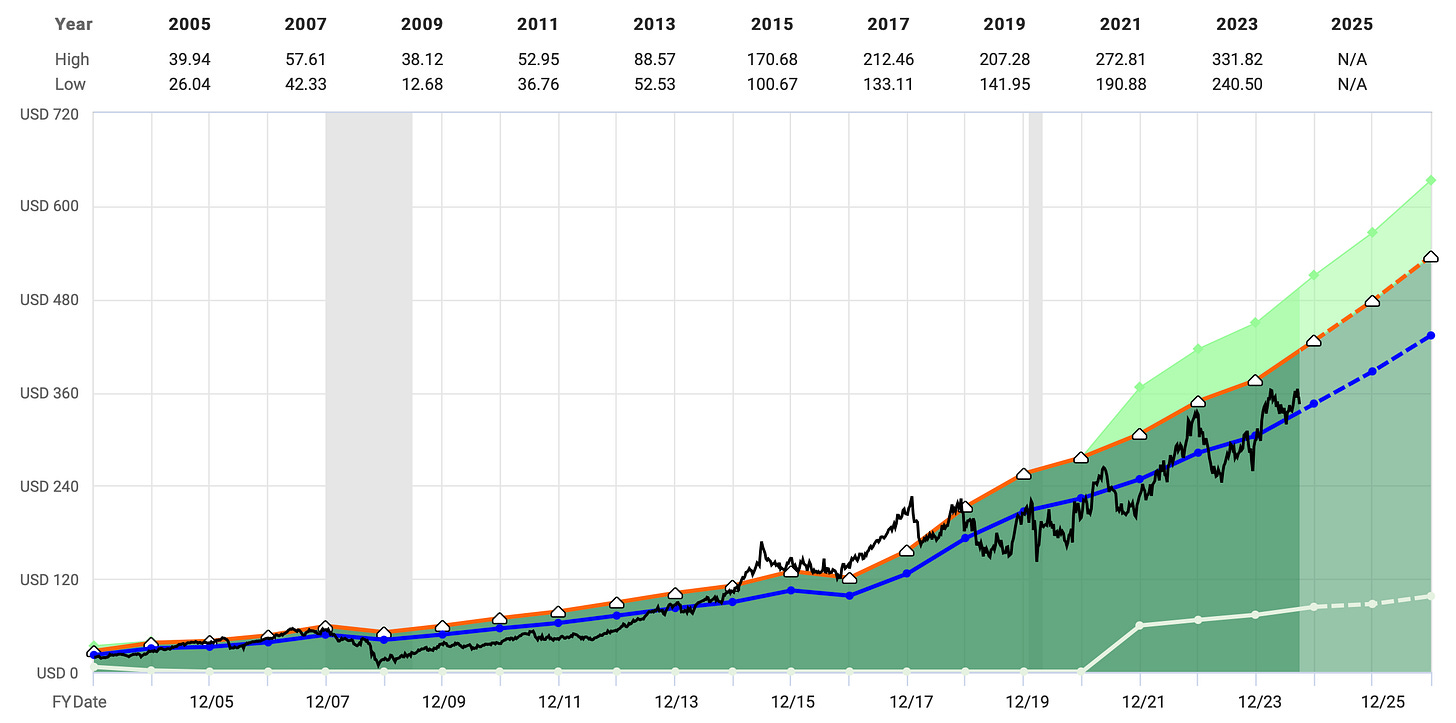
To illustrate the wild swings of the market (and point out the buying opportunities) let’s examine Cigna Group (ticker: CI) in one of my favorite tools, FASTgraphs.
Will look at a few metrics for the company’s stock between 2005 to where it is now in 2024.
The smooth blue line on the graph represents the price-to-earnings (P/E) multiple that the market has valued the company over time. The P/E line gradually rises from the left (2005) to the right (2024).
The jagged black line represents the price Cigna Group has traded at during the same time period. The price has also risen from left to right, but it’s a lot more sporadic and volatile.
Following the black price line, you can see how the pendulum swings on Cigna Group as the market jumps in and out of the stock. The market was over optimistic in 2014, 2017, 2018, 2020, 2022, and early 2023. Between these years, the market sharply swung pessimistic with extreme drops.
When we ignore the price, it’s clear that the smooth blue line, which in my mind, provides a better view of the company’s fundamentals, is steadily growing throughout the years.
In this case, the blue line could be a good indicator of fair value - the point in time when the pendulum is at rest. The “valleys”, represented by the falling black line, represent the opportunity to buy the stock at a discount.
The patient investor (remember that’s you and me) waits for those moments when the market sells off to sweep in and buy our favorite companies at a great price!
We’ll be diving more into this as we go, taking a look at the 30-stock portfolio, and investing into our favorite companies when everyone else overlook them.
Until next time… keep walking,
Jeremy ✌️


